Sudhanshu Handa and Zhiyuan Liu | 8th September, 2022
Sudhanshu Handa and Zhiyuan Liu discuss how a machine learning technique can be applied to study the impact of unconditional cash transfers on different programme participants and contribute to the development of a middle range theory on graduation out of poverty.
A typical impact evaluation reports the average effect of a treatment, yet we know that in many cases the actual impact can vary quite significantly across different types of programme participants. The classical approach is to draw on existing theory to make hypotheses about what groups might be more or less affected by the programme, and then test this by estimating treatment effects on these different groups. Sometimes identifying groups can be straightforward, for example, a nutrition intervention administered through a health facility would probably have a larger effect on those living closer to the facility. But, for many interventions, identifying these groups is not so easy, either because the intervention is complex or because different groups can respond differently to the intervention in ways that are not easy to predict beforehand. In addition, there may be a combination of characteristics, unknown to the researcher, that lead to different treatment responses. In these cases, machine learning algorithms provide a way to let the data identify which types of recipients benefit the least or the most from an intervention.
How machine learning can help classification
Athey & Imbens (2016) have extended a classical machine learning developed methodology for use in causal analysis. Their approach, known as a Causal Classification Regression Tree (C-CART), partitions or classifies observations into groups based on their degree of sameness on a particular outcome, where the outcome is the impact of an intervention. For example, we might want to know if a particular intervention has a different impact for men relative to women. With just one characteristic we can easily compare the mean impact for men to those of women. However, if we have many different characteristics of interest (sex, age, schooling, area of residence, etc) then comparing all possible pairs becomes difficult. More importantly, it might be the combination of characteristics in a beneficiary that generates a large impact (for example, the combination of being a young woman with low education living in a rural area without any children) rather than any one characteristic by itself. It is precisely this problem, where there are a large number of potential combination of traits to sift through, that machine learning tools in general, and the C-CART in particular are most useful.
Behaviours and choices affect the impact of cash transfers
Unconditional cash transfers (UCTs) provide an interesting case study for the C-CART approach. A UCT is a social protection programme that provides regular, predictable cash support to families, usually those who are poor or have young children, an elderly member or a person living with a disability. The World Bank (2015) estimates that over 1 billion people in low- and middle-income countries receive some type of cash transfer from their government.
When households receive UCTs they can choose how to spend the transfer since it is unconditional. In particular, they can use the funds for their most pressing needs as they see them; some households may prefer to send kids to school, others may invest in livestock, others in a small business. These different potential choices make the behavioural response to the intervention hard to predict beforehand.
Another aspect that complicates the analysis of impact of UCTs is that the choice of how to spend the cash and the resulting impact may also depend on household characteristics such as family size and structure, schooling, age and sex of main decision-makers. And, beyond the household’s characteristics, there are a range of contextual factors such as soil quality and climate, distance to infrastructure, availability of a school, that also affect household choices and associated impacts. The resulting combination of characteristics and choices is enormous, and existing theory provides limited guidance on what combinations are ideal for generating the largest treatment effect. This is an ideal scenario to apply the C-CART as it lets the data inform us about the combination of characteristics that lead to different treatment responses. Indeed, results generated from a C-CART across multiple interventions can help inform a theory of change, which is the ultimate objective of this project.

Cases from Malawi and Zambia
In our CEDIL-funded project, we apply the Athey & Imbens C-CART to evaluation data from four government UCTs in Africa, in Zambia, Malawi, Ghana and Zimbabwe. Information about these evaluations and their average treatment effects can be found at the Transfer Project website.
Our outcome is the treatment effect on consumption per capita, which is the preferred metric for assessing monetary well-being. We use over 30 individual characteristics covering household, contextual and climatic domains. Initial results for Malawi and Zambia are shown in figure 1 where treatment effects are measured in standard deviation units on the x-axis, and the frequency of households at each level of treatment are given by the height of the bars (y-axis). Both programs were quite successful, with the average treatment effect on consumption of 0.3SD and 0.4SD in Malawi and Zambia respectively. However, as the graphs illustrate, the effects range from 0.1SD to 0.6SD in Malawi and 0.9SD in Zambia – clearly there were some ‘high flyers’, households that realized very large gains in consumption due to the UCT, as well as ‘low flyers’ for whom the UCT had very little effect.
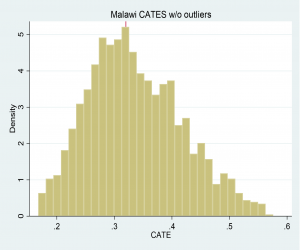
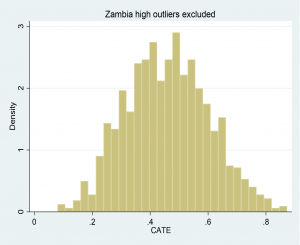
Figure 1: Illustrative Conditional Average Treatment Effects in Malawi and Zambia
What are the characteristics of ‘high flyers’?
Having identified our low- and high-flyers, we analyse their respective characteristics to understand the combination of pre-treatment features that led some households to realize large benefits relative to others. Figure 2 presents selected pre-treatment characteristics of low- and high-flyers for Zambia. The first set of bars in the graph shows that high-flyers have fewer young children, smaller households and heads with more education; the middle set of bars indicate they live closer to the district capital and in areas with more rainfall. All of these results seem intuitive. However, the last set of bars shows that high-flyers had significantly less ownership of livestock and productive assets. The results for Malawi are similar to those shown for Zambia.
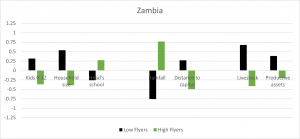
Figure 2: Selected pre-treatment characteristics of low- and high-flyers for Zambia
Towards a middle-range theory of graduation
The results for Malawi and Zambia point to a unique combination of starting characteristics among high-flyers: favorable household characteristics (smaller size, fewer children) and a favorable environment (more rain, closer to markets), but with lower productive assets. This combination of characteristics could not necessarily have been predicted beforehand, thus illustrating the power of machine learning to uncover patterns in the data that can subsequently be used to refine or develop new theory about sustained poverty reduction. In terms of policy, there is currently a focus in Africa on providing complementary services to cash transfer beneficiaries to enhance program impacts. Evidence on the characteristics of high- and low-flyers in these programs can help policy-makers tailor complementary services to specific groups of households to enhance program impacts.
Sudhanshu Handa is Kenan Eminent Professor of Public Policy at University of North Carolina and Institute fellow at the American Institutes for Research, Zhiyuan Liu is a PhD student in Computer Science at the University of North Carolina.
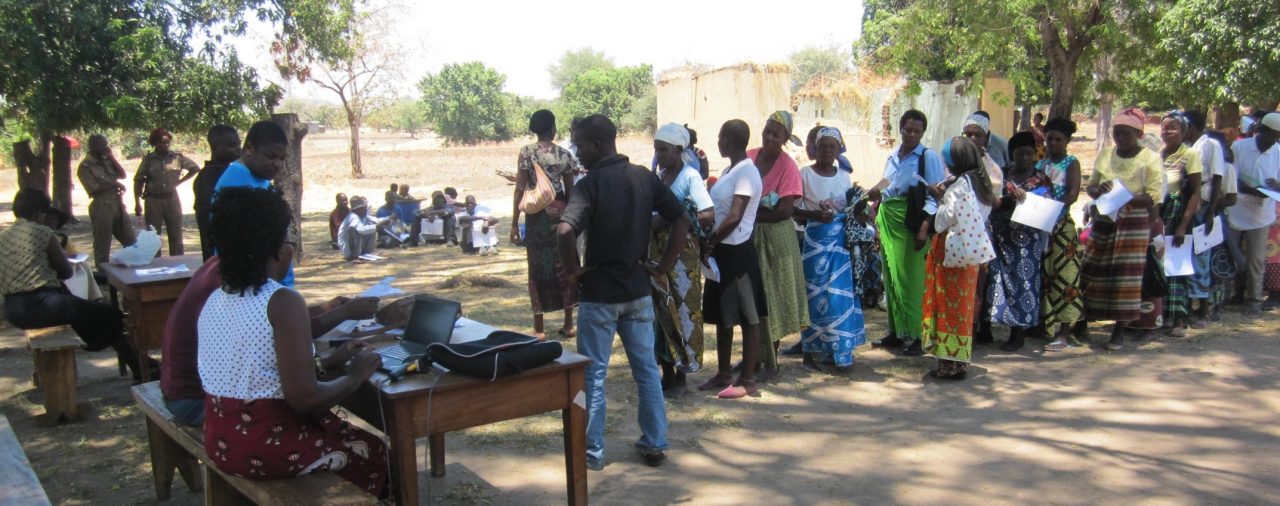
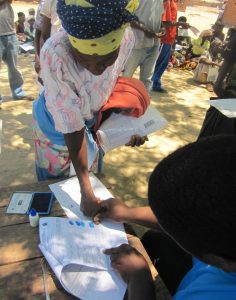
Cover image: Malawi SCTP paypoint. Images taken by Sudhanshu Handa, Michelle Mills and Maxton Tsoka