
Calum Davey and Matt Juden discuss how an experimental Bayesian method can be used in re-analysis of a nutrition-sensitive agriculture intervention.
In an upcoming paper we will describe the initial stages of a re-analysis of a nutrition-sensitive agriculture intervention using an experimental Bayesian method we have developed. We detail the process of translating the theory of change for a complex intervention into a formal model of the sort used in the causal-inference literature, a directed acyclic graph (DAG). We then explain how open-source software can be used to formally update beliefs about the causal processes throughout the theory of change using process and impact data. Through this process we learned that creating a DAG can be a very useful guide to analysis, forcing a greater level of clarity about intervention theory than a somewhat ambiguous theory of change. In this case, making the DAG uncovered an important moderator and suggested that more efficient data collection might have been possible by focusing on what was expected to be causally important. We also overcame many technical and conceptual challenges to augment the capabilities of the opensource software which we used, called CausalQueries, allowing it to handle more complex models and opening up possibilities for future researchers. This blog post walks through some of what we did and reflects on the challenges and next steps.
We partnered with a team at the London School of Hygiene and Tropical Medicine who led an evaluation of a series of interventions that aimed to improve dietary diversity (among other things) in rural India. The interventions combined information, home visits, and self-help groups in different configurations in a four-arm cluster randomised trial. We focused on the simplest of these arms – the arm that offered tailored information videos about agricultural practice – and how it compared to the control. Fortunately for us, the team were excited to try to learn more about their intervention and were graciously willing to test out our processes.
The first thing we set out to do was to translate the theory of change into a causal model. Other work supported by CEDIL has shown that theories of change can be presented in myriad different ways and are generally ambiguous as to the precise causal theory underlying them. This is for good reason, as theory of change diagrams generally have to fulfil multiple functions. For example, many must be easily legible to non-expert audiences and aesthetically pleasing in order to be persuasive to funders and other external parties. It is the ambiguity of most theory of change diagrams that renders them unsuitable for grounding a formal integration of theory with data. By contrast, DAGs obey very simple rules to create unambiguous objects. DAGs are made up of boxes (or nodes,) connected by single-headed arrows (or directed edges,) and must contain no loops. They can also contain double-headed arrows, sometimes dotted, which represent the confounding of a relationship between two nodes by one or more further nodes not represented on the DAG.
DAGs have a mixed reputation in impact evaluation with some hailing them as a revolutionary tool while others dismiss them. We hope to show that DAGs are a useful tool and to explain some of the limitations of formal Bayesian causal analysis based on a DAG. The reason the DAG was the right tool for this project is because it is an unambiguous map of causal relations which can ground a formal integration of theory and data. We use it to create a formal Bayesian model of intervention theory and jointly update that model on data from process and impact evaluation. We also use it to elicit from experts their prior beliefs about the strength of relationships in the model and inform our analysis on the basis of these prior beliefs, showing how and to what extent exposure to the data should change these beliefs. We deal with that part of our analysis in a future paper, limiting ourselves here to model specification and updating with data.
Difficult as it can be to be explicit about underlying causes, the Upscaling Participatory Action and Videos for Agriculture and Nutrition (UPAVAN) evaluation team – made up of researchers based in London and in India – translated their pictorial theory of change into a DAG in a couple of online workshops and some emails. This process went through several iterations which led to the final analysis DAG below:
UPAVAN analysis DAG
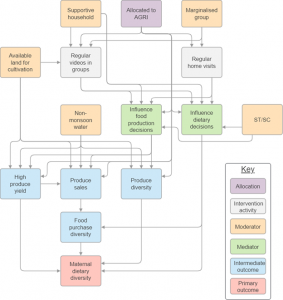
All models are simplified representations of a more complex reality and decisions must be made about what to include and what are the most important things to include. The process of creating the DAG revealed to the UPAVAN team that having a supportive household was a key moderator of the effects for women in the intervention which had not been fully appreciated when conducting the original evaluation. In addition, the process of creating the DAG suggested that, like very many development interventions, an enormous wealth of data had been collected on recipients of the intervention that was not about elements of the model, raising the possibility that the questionnaire could have been shorter, saving time for the participants and the data collectors.
The software we used to encode the DAG as a Bayesian causal model is called CausalQueries and was originally developed for use in Political Science by our colleagues on this project Macartan Humphries and Alan Jacobs. It is a package for R which can be used to make models, plot them as DAGs, and then update them on data using the Bayesian fitting software Stan. Models can then be queried for all sorts of parameters including complex counterfactual queries we discuss below. When attempting to encode, update and query the UPAVAN model we found out that we had several obstacles to overcome and have had to augment CausalQueries to handle ternary and quaternary nodes as well as binary, to run more efficiently and in a way that makes use of parallel processing so as to update large models faster, and to break large, uncomputable models down into smaller computable chunks before stitching them back together. Some of that work is described in this paper with more coming in future papers.
Despite all of our work, many limitations of this approach remain. A CausalQueries-powered Bayesian modelling approach is not suitable for theories in which more than five ‘parent’ nodes cause changes in one ‘child’ node. It is also limited to the analysis of nodes with four values or less, and is ideally suited to the analysis of binary nodes only. We have shown that theories such as the theory underlying the simplest arm in the UPAVAN trial can be represented within these limits. However, like all tools CausalQueries is not ideally suited to answering every sort question.
Eventually, we were able to encode the UPAVAN DAG as a Bayesian causal model in CausalQueries and to update that model on process and outcomes data from the UPAVAN intervention. With the model updated we were finally ready to use it to learn something new. However, this is where we stopped for now, instead illustrating some of the potential of having such a model of which to ask questions; questions about mediation, moderation, and complex questions such as ‘if this woman received the intervention and has good dietary diversity, what is the probability that this would not have been the case in the absence of a non-monsoon water supply?’. We will describe the process of asking those questions as well as what we learned from the UPAVAN reanalysis and two other partnerships with evaluation teams in a future paper in this series.
[…] We took a two-stage approach to formalising our partner team’s theories about how the intervention was supposed to work. First, we had to discover the structure of their mental model(s) of intervention causation. This meant starting from theory of change diagrams and supporting text about intervention theory and working together to create a directed acyclic graph (DAG). We talk about this process in relation to the UPAVAN intervention in our previous blog post. […]